Power BI · Excel · Data Cleaning · Reporting Systems

Clear dashboards.
Reliable reporting.
Better decisions.

We help small businesses, clinics, and operations teams — anywhere in the world — turn messy spreadsheets and unreliable reporting into clean analytics that drive confident decisions.

15+/ Projects completed
100%/ On-time delivery
24 hrs/ Response time

Tools we work with

Power BIExcelPythonSQLBigQueryPower QueryDAXPandasTableauGCPApache AirflowPyTorchTensorFlowSeaborn

Industries we've built reporting for

Healthcare operationsSmall businessesRetail businessesMarketing teamsStartupsOperations teams

If any of this sounds familiar, you're in the right place.

These aren't small problems. Unreliable reporting slows decisions, erodes trust in your data, and creates real operational risk. That's what we fix.

Your spreadsheets work, but nobody fully trusts the numbers.

You're pulling the same manual report every week and it takes hours.

Your dashboards exist, but they're out of date or nobody uses them.

You have data. You just can't get a clear answer from it.

You went through a system migration and now your reports don't reconcile.

Your KPIs look different depending on who pulls them.

What We Do

Practical analytics work — not theory. Every engagement is focused on a clear outcome you can see and use.

dashboard

Power BI Dashboards

We build Power BI dashboards that connect to your actual data sources — not static exports. You get real-time KPIs, filters your team can use, and a report that stays accurate without manual effort.

Good for: Teams that need visibility across sales, operations, finance, or clinic performance.

Power BIDAXPower QuerySQLTableau
monitoring

KPI Reporting Systems

We help you identify the metrics that matter, build a reporting routine around them, and give you a clear view every week or month — with no manual work. We also build predictive forecasts so you can see where your numbers are heading — and cover operational research work like finance workflows, labor hours, and supplier invoice tracking.

Good for: Business owners and managers who need reliable reporting they can trust.

Power BIExcelSQLPython
table_chart

Excel Dashboards & Reporting

Not every team needs a full BI platform. We build Excel dashboards and reporting workbooks that are clean, structured, and built to last — with Power Query automating the routine work.

Good for: Small teams where Excel is already the tool of record.

ExcelPower QueryPower Pivot
auto_fix_high

Data Cleaning & Transformation

If your source data is messy — duplicate rows, inconsistent formats, missing values — your reports will always be wrong. We clean it, document it, and build processes so it stays clean. We also handle database migrations from SAP or legacy systems to GCP and Google platforms, build automated pipelines to keep data flowing reliably, and run financial discrepancy detection to surface irregularities in invoices, supplier costs, and labor records.

Good for: Teams preparing for a migration, audit, or analysis project where data quality is a blocker.

PythonSQLPandasPower QueryGCPAirflow

Not sure which fits your situation?

Book a Discovery Call

Who We Work With

We work best with teams and business owners who have real data problems — not hypothetical ones.

Small business owners

You're running the business, not analysing data for a living. You need clear, simple reporting that tells you how things are going — without hiring a full-time analyst.

Operations teams

Your team pulls manual reports every week. It takes too long, the numbers don't always match, and nobody fully trusts them. You need a better system.

Clinics & healthcare operations

Patient flow, appointment data, billing reconciliation, KPI tracking — healthcare reporting has unique complexity. We've worked with healthcare data and understand the environment.

Startups & growing companies

You've been running on spreadsheets. It worked for a while. Now the business is bigger and the reporting is starting to break down. Time to build something that scales.

Teams recovering from a bad migration

Your data moved to a new system, but the reports aren't reconciling and you're not sure what you can trust. We've done this kind of audit work before.

If your situation isn't on this list but you have a data or reporting problem, reach out — we'll tell you honestly if we can help.

Book a Discovery Call

// Recent Work

Real work.
Real results.

Real projects. Real problems. Documented outcomes.

Background

EnterpriseHealthcare
Power BI data model for hospital patient flow analytics — real-time bed occupancy and admission dashboard
Healthcare Operations

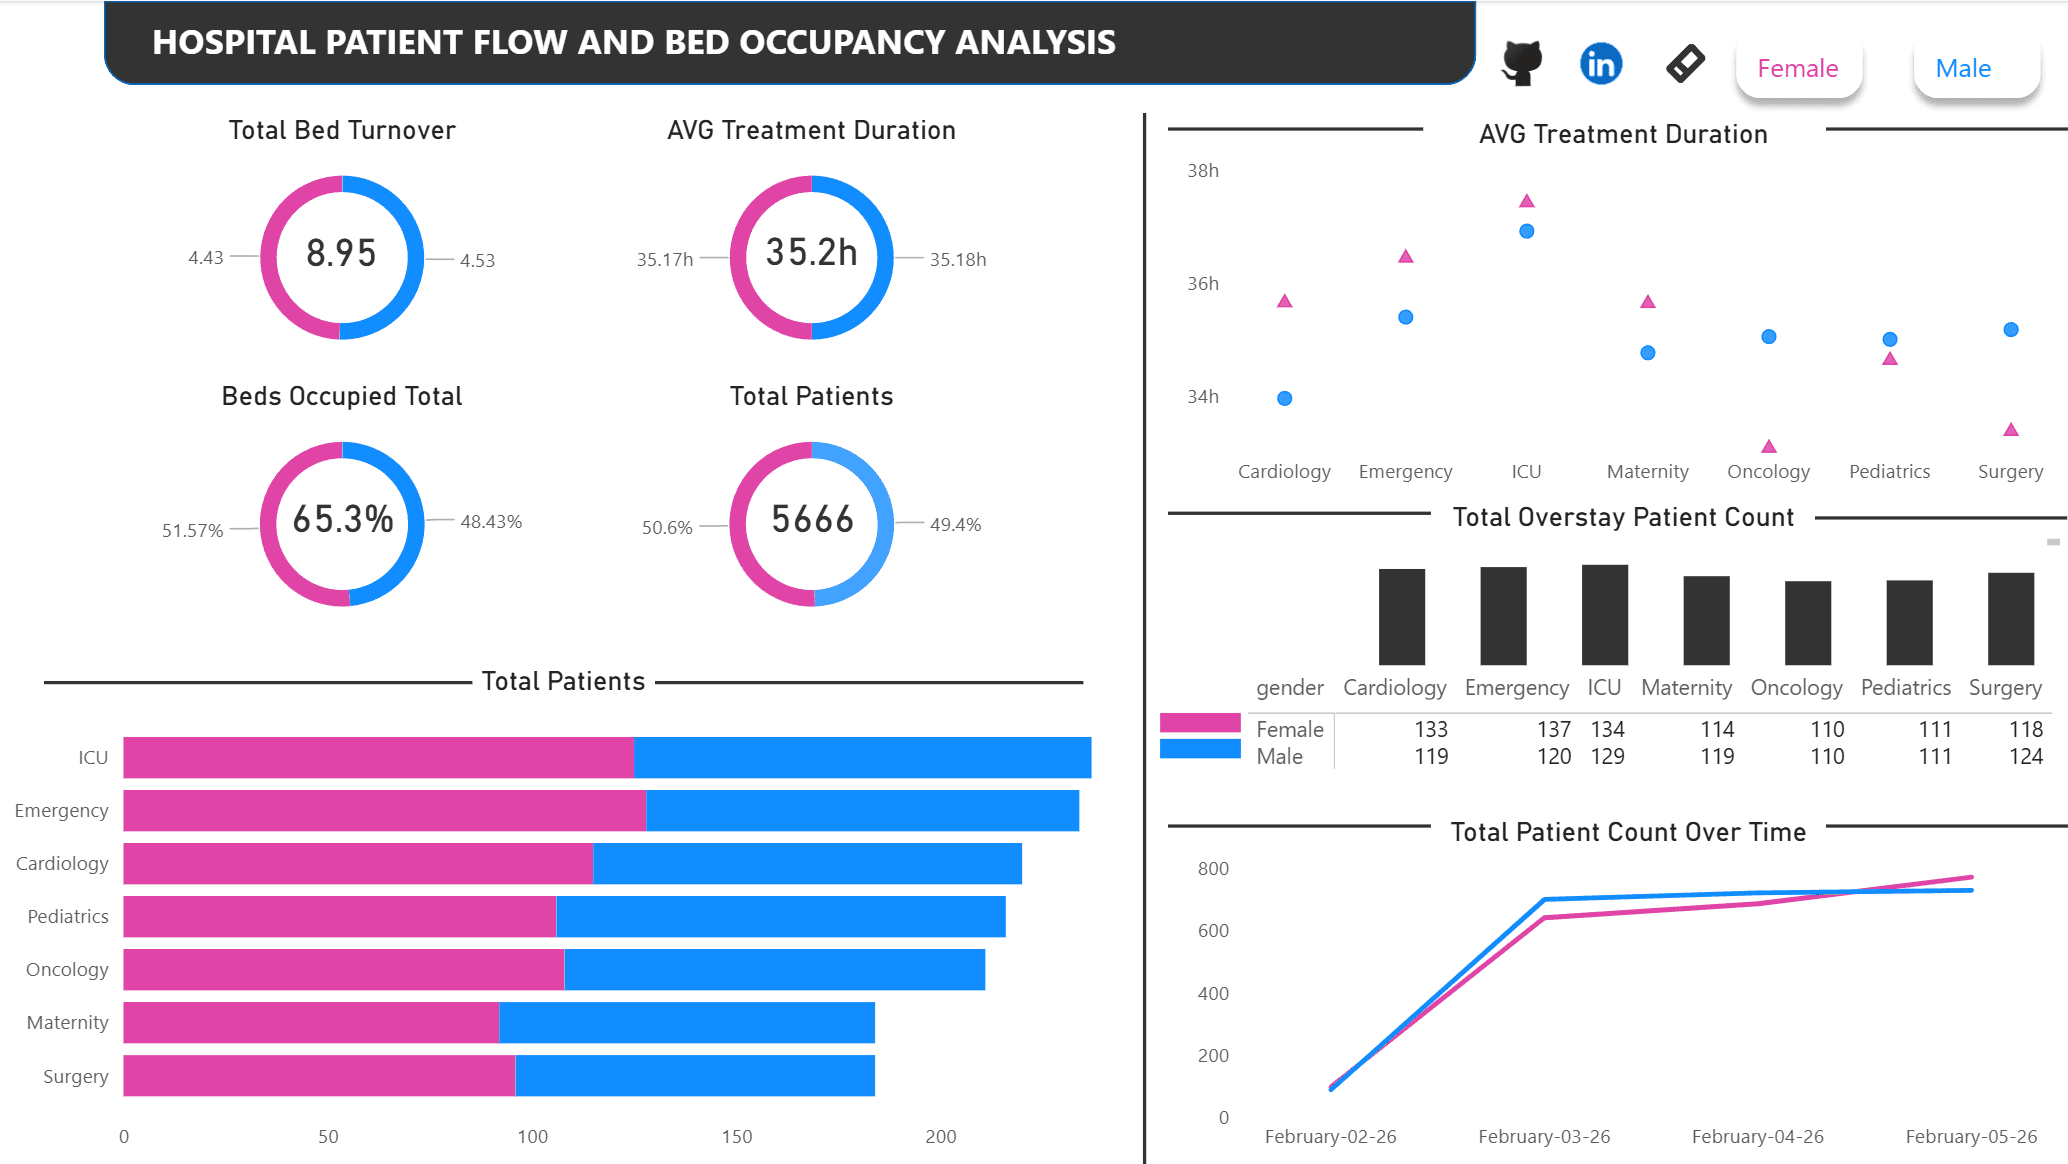
Hospital Patient Flow Analytics

Real-time operational dashboard

Problem

No real-time visibility into bed occupancy. Clinical decisions relied on day-old manual data exports.

Approach

Connected live hospital data to a Power BI dashboard with automated refresh and department-level KPIs — no manual pulls required.

Result

Live bed occupancy and length-of-stay tracking available to all departments. Zero manual exports.

Tools Used

Power BIDAXSQLReal-time
Clean marketing campaign data output showing standardized columns and corrected records
Data Cleaning

Marketing Campaign Data Cleanup

Dataset normalization & validation

Problem

A 2,000-row marketing dataset had inconsistent formats and 34 date errors — making reports unreliable for analysis.

Approach

Built a Python/Pandas pipeline to normalize fields, fix date errors, cap outliers, and reduce categories from 10 to 6.

Result

All 34 errors resolved. Dataset cleaned, validated, and ready for reliable reporting.

Tools Used

PythonPandasColab
Excel QA Summary dashboard showing appointments migration exceptions and reconciliation pivot
Excel / Data Audit

Post-Migration Appointment Audit

Data quality & exception reporting

Problem

After a system migration, no validation was in place. A cancellation rate spike from 6% to 33% went completely undetected.

Approach

Built a refreshable Excel QA workbook with Power Query staging, exception flagging, and pivot-based reconciliation across 7 categories.

Result

9 high-severity exceptions surfaced and documented. Full audit trail delivered — stakeholder-ready.

Tools Used

ExcelPower QueryPower Pivot
Top 10 most popular bike share start stations — BigQuery SQL analysis bar chart
SQL Analytics

Bike Share Ridership Analysis

Usage patterns & demand analysis

Problem

15,000 rides across 25 stations — no validated analysis of usage patterns, peak demand, or rider behaviour.

Approach

Loaded three CSV files into BigQuery, validated data quality, then analysed patterns using SQL JOINs, CTEs, and window functions.

Result

Peak demand confirmed at 15:00–16:00. Casual riders averaged longer trips than subscribers — actionable for operations.

Tools Used

BigQuerySQLPython

Want to see how this applies to your business?

Book a Discovery Call

How We Work

A clear, low-friction process — from first call to finished deliverable. Most projects take 1–3 weeks depending on scope.

01

Discovery Call

15 min · Free · No commitment

We talk through your current reporting situation, what's broken, what you need, and whether we're the right fit to help. No sales pitch.

02

Scoping & Proposal

Written, clear, no surprises

We send a written proposal: what we'll build, what you'll need to provide, the timeline, and the cost. You review it before anything starts.

03

Build & Review

Progress updates throughout

We do the work and keep you in the loop. You review deliverables before we finalise anything — no black-box development.

04

Handoff & Documentation

You own it when we're done

You get the finished deliverable plus documentation so you understand what was built and how to use it. We don't disappear after delivery.

Ready to start? The discovery call costs nothing and comes with no obligation.

Book a Discovery Call

Why Work With Us

Our team consists of two senior analysts: one holds a PhD in machine learning and engineering, while the other brings hands-on experience building large-scale data systems across tech, healthcare, and banking.

We're also supported by two skilled data analysts and a business analyst — giving us the depth to handle everything from raw data cleaning to executive-level reporting.

Together we work with smaller teams who have the same problems as large enterprises — but don't have a full analytics department to fix them.

We ask questions before we build anything.

We explain what we're doing in plain English.

We document our work so you're not dependent on us forever.

We'll tell you if your problem is outside our scope.

You get senior-level attention — not handoffs to junior staff.

Our focus

We're not a generalist agency. We specialise in Power BI, Excel, data cleaning, and reporting systems.

That's it. That's what we're good at. If you need clean data and clear dashboards — and you want a team that will actually deliver — we'd like to help.

What we work with

Power BIExcelPower QueryDAXSQLPythonBigQueryPandasTableauGCPApache AirflowPyTorchTensorFlowSeaborn
Book a Discovery Call

Common Questions

Have a question that's not answered here?

Ask us directly

Your Data Is Safe With Us

Used only to complete your engagement

Any data you share with us — spreadsheets, exports, reports — is used exclusively to do the work you hired us for. Nothing else.

Never stored, sold, or shared

We do not retain client data beyond project completion, sell it to any third party, or use it for any purpose outside your engagement.

Conducted under a confidentiality agreement

All work is covered by a confidentiality obligation. What you share with us stays with us — and is deleted when the project is done.

Full policy available

Read our complete Privacy Policy for everything we collect, how we use it, and your rights.

Let's fix your reporting.

Start with a free 15-minute discovery call. You describe your situation — we tell you what's possible and whether we can help.

1Fill out the form (2 minutes)
2We reply within 24 hours
3We schedule a 15-minute call
4You receive a written proposal — no pressure